Additionally, we analyzed the distribution of the catalytic types of the known and predicted reactions (Figure S3). Hereafter, the first and second digits of the EC numbers are referred to as "EC class" and "EC subclass", respectively. In this analysis, we employed a strategy that "Similar pairs belong to a similar EC class and subclass" using Diff-common and Diff-only feature vectors. The accuracy of this method has not been strictly estimated, but this method was fairly simple and quick to overview the distribution of EC numbers for the vast numbers of compound pairs.
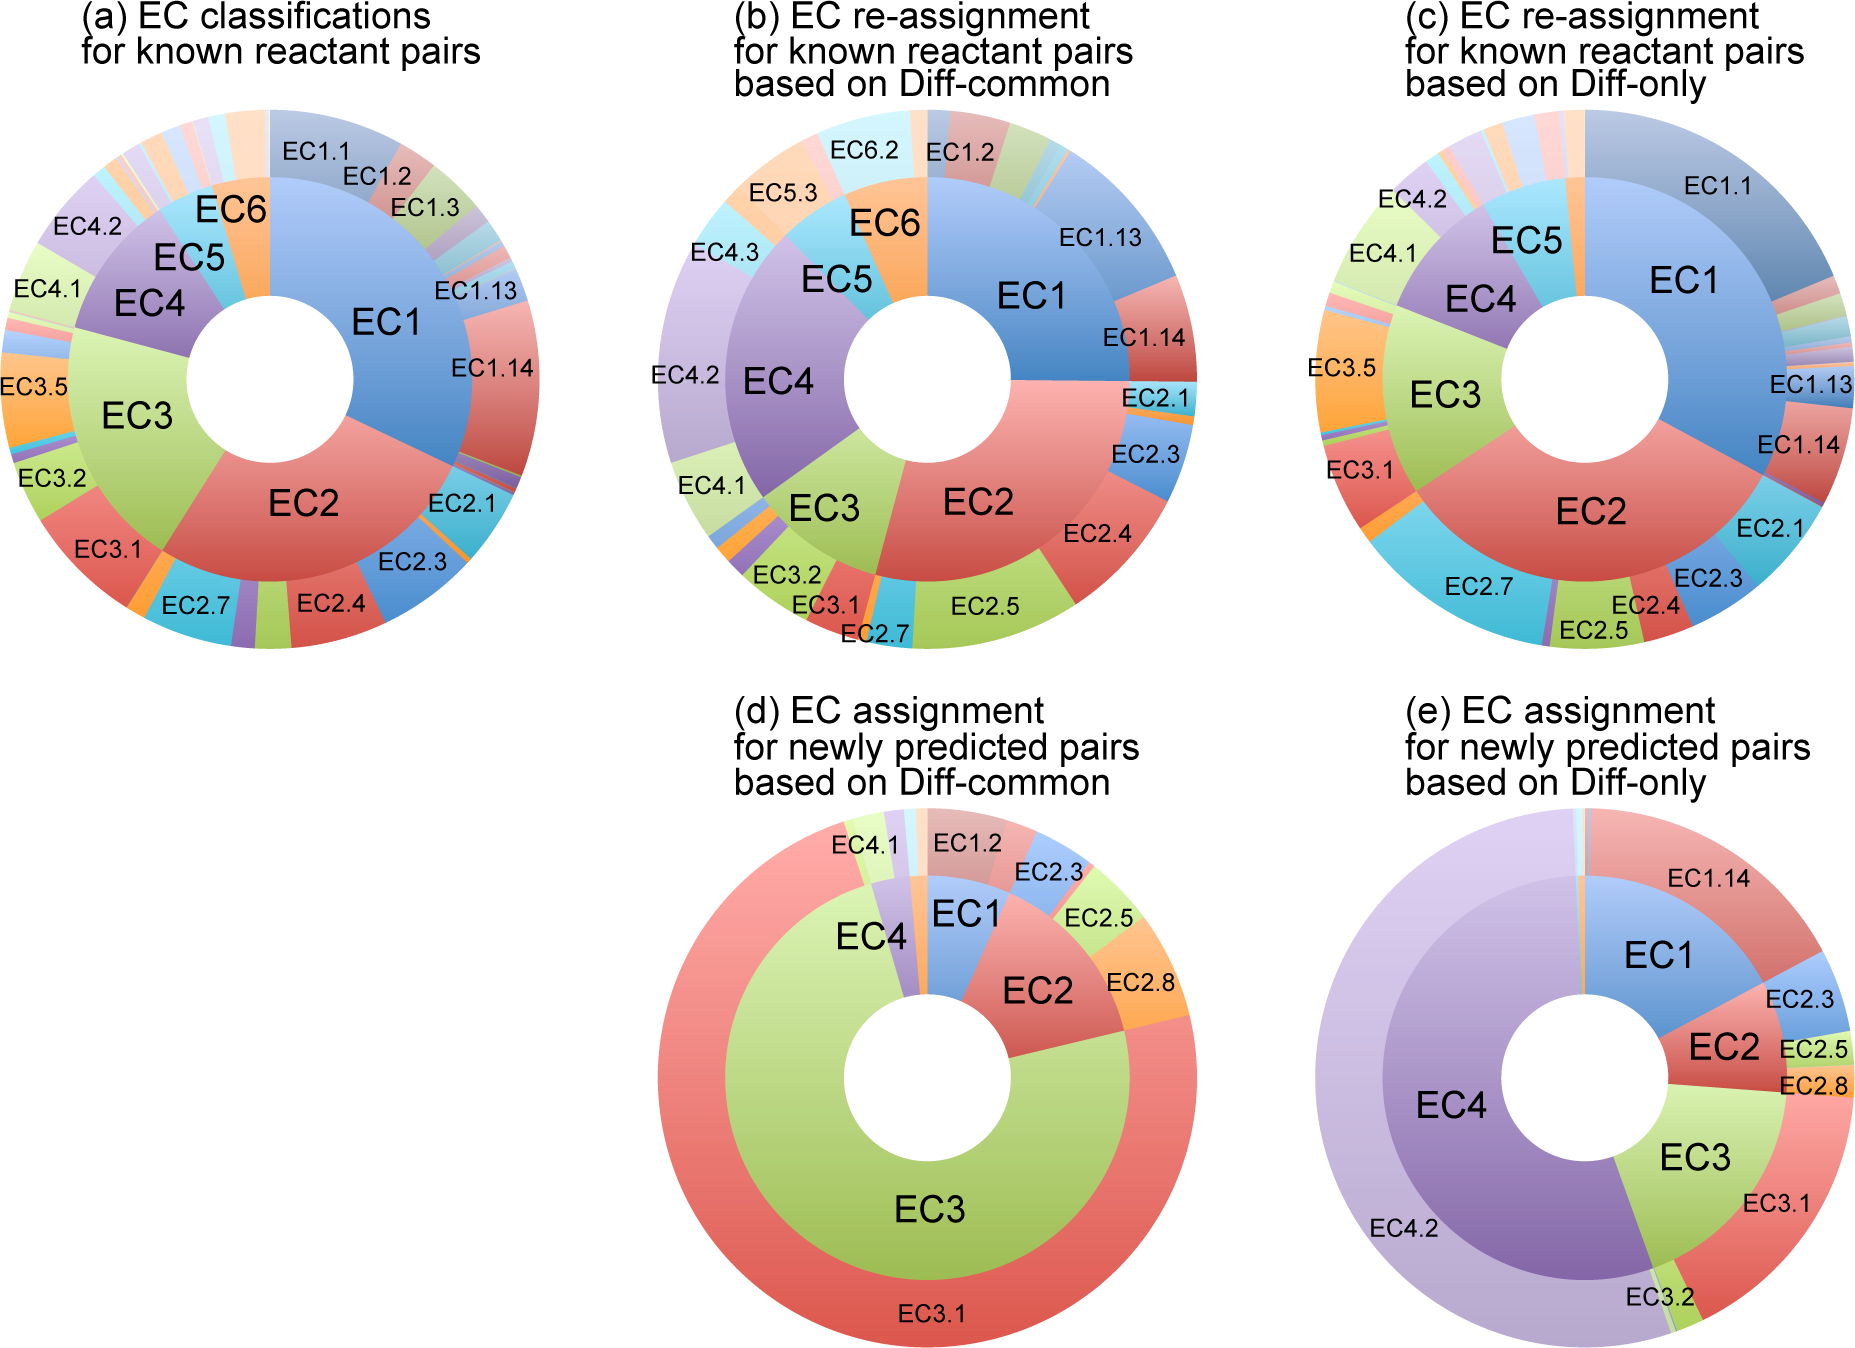
(a) EC classifications for known reactant pairs: EC classes and subclasses given for the KEGG reactant pairs were counted. When a reactant pair belongs to only one EC class or subclass, the EC class and subclass are given one count each. When a reactant pair belongs to more than one EC classes or EC subclasses, its count is divided. For example, if a reactant pair appears in the EC numbers EC 1.1.1.1, EC 1.2.3.4, EC 2.2.2.2 and EC 3.3.3.3, then EC1, EC2 and EC3 are given 0.5, 0.25 and 0.25 counts, respectively. EC1.1, EC1.2, EC2.2 and EC3.3 are given 0.25 counts each. The resulting pie chart represents the distribution of EC classifications for known reactant pairs (Figure S3a).
(b) EC re-assignment for known reactant pairs based on Diff-common: In the 5-fold cross-validation (section 4.1 in the main article), small part of known reactant pairs were regarded as if they were unknown (referred to as test set), and the enzymatic-reaction likeness was estimated (referred to as training set). In this analysis, in addition to the 5-fold cross-validation, the EC classes and subclasses of the training set pair that was the most similar with the test set pair in terms of Diff-common feature vector were regarded (re-assigned) as the EC classes and subclasses of the test set pair. EC classes and subclasses for such test set pairs were counted in the same way as a. The resulting pie chart represents the distribution of EC re-assignment for known reactant pairs based on Diff-common (Figure S3b).
(c) EC re-assginment for known reactant pairs based on Diff-only: EC classes and subclasses were counted in the same way as b but with Diff-only feature vector, resulting in the distribution of EC re-assignment for known reactant pairs based on Diff-only (Figure S3c).
(d) EC assignment for newly predicted pairs based on Diff-common: In the prediction of new reactions (section 4.4 in the main article), enzymatic-reaction likeness was calculated on each compound-compound pair that was not found in known reactant pairs. In this analysis, similarity to (b), the EC classes and subclasses of the the known reactant pair that was the most similar with the compound-compound pair in terms of Diff-common feature vector were regarded (assigned) as the EC classes and subclasses of the compound-compound pair. EC classes and subclasses for such test set pairs were counted in the same way as a. The resulting pie chart represents the distribution of EC assignment for newly predicted pairs based on Diff-common (Figure S3d).
(e) EC assginment for newly predicted reactant pairs based on Diff-only: EC classes and subclasses were counted in the same way as d but with Diff-only feature vector, resulting in the distribution of EC assignment for newly predicted pairs based on Diff-only (Figure S3e).
By the comparion with the distribution of known reactant pairs (a) and newly predicted pairs (d and e), it was clearly shown that the distribution of predicted reactions is different from that of known reactions, and Diff-common and Diff-only feature vectors favour different molecules or reactions. For example, Diff-common feature vector found compound-compound pairs that are possibly catalyzed by EC3 (d), and Diff-only feature vector found those by EC4 (e). It is supposed that this bias is partly due to the given compound sets, and partly due to the reaction types that the proposed method can deal with. We assume that the former is the main reason of the bias in the new prediction, because the re-assignment experiments (b and c) did not show significant difference from the original EC classifications (a) compared with new predictions (d and e).