
We analyzed the topology of the reaction network generated by high scoring prediction scores. The network topology does not necessarily imply that the resulting pathways are biochemically plausible. Still, as long as the investigation described below, there was nothing unnatural in the generated network topology.
Compound-compound pairs with positive prediction scores were sorted in the descending order, and the top 10%, 30%, 50%, 70% and 90% of the pairs were used to generate a reaction network, where compounds and compound relations were represented as nodes and edges, respectively.
Figure S1 shows the degree distribution of the reaction network generated with the diff-common feature vectors. The network consisting of the KEGG reactant pairs was almost in power law, except the number of nodes with the degree = 1. The generated network with relatively high prediction scores (up to the top 50%) seems to follow power law, although, as the more pairs with lower prediction scores are incorporated into the network, the network topology changes. This would be due to the incorporation of unignorable numbers of false positive pairs. The degree distribution of the networks generated with the diff-only feature vectors did not show significant differences (data not shown).
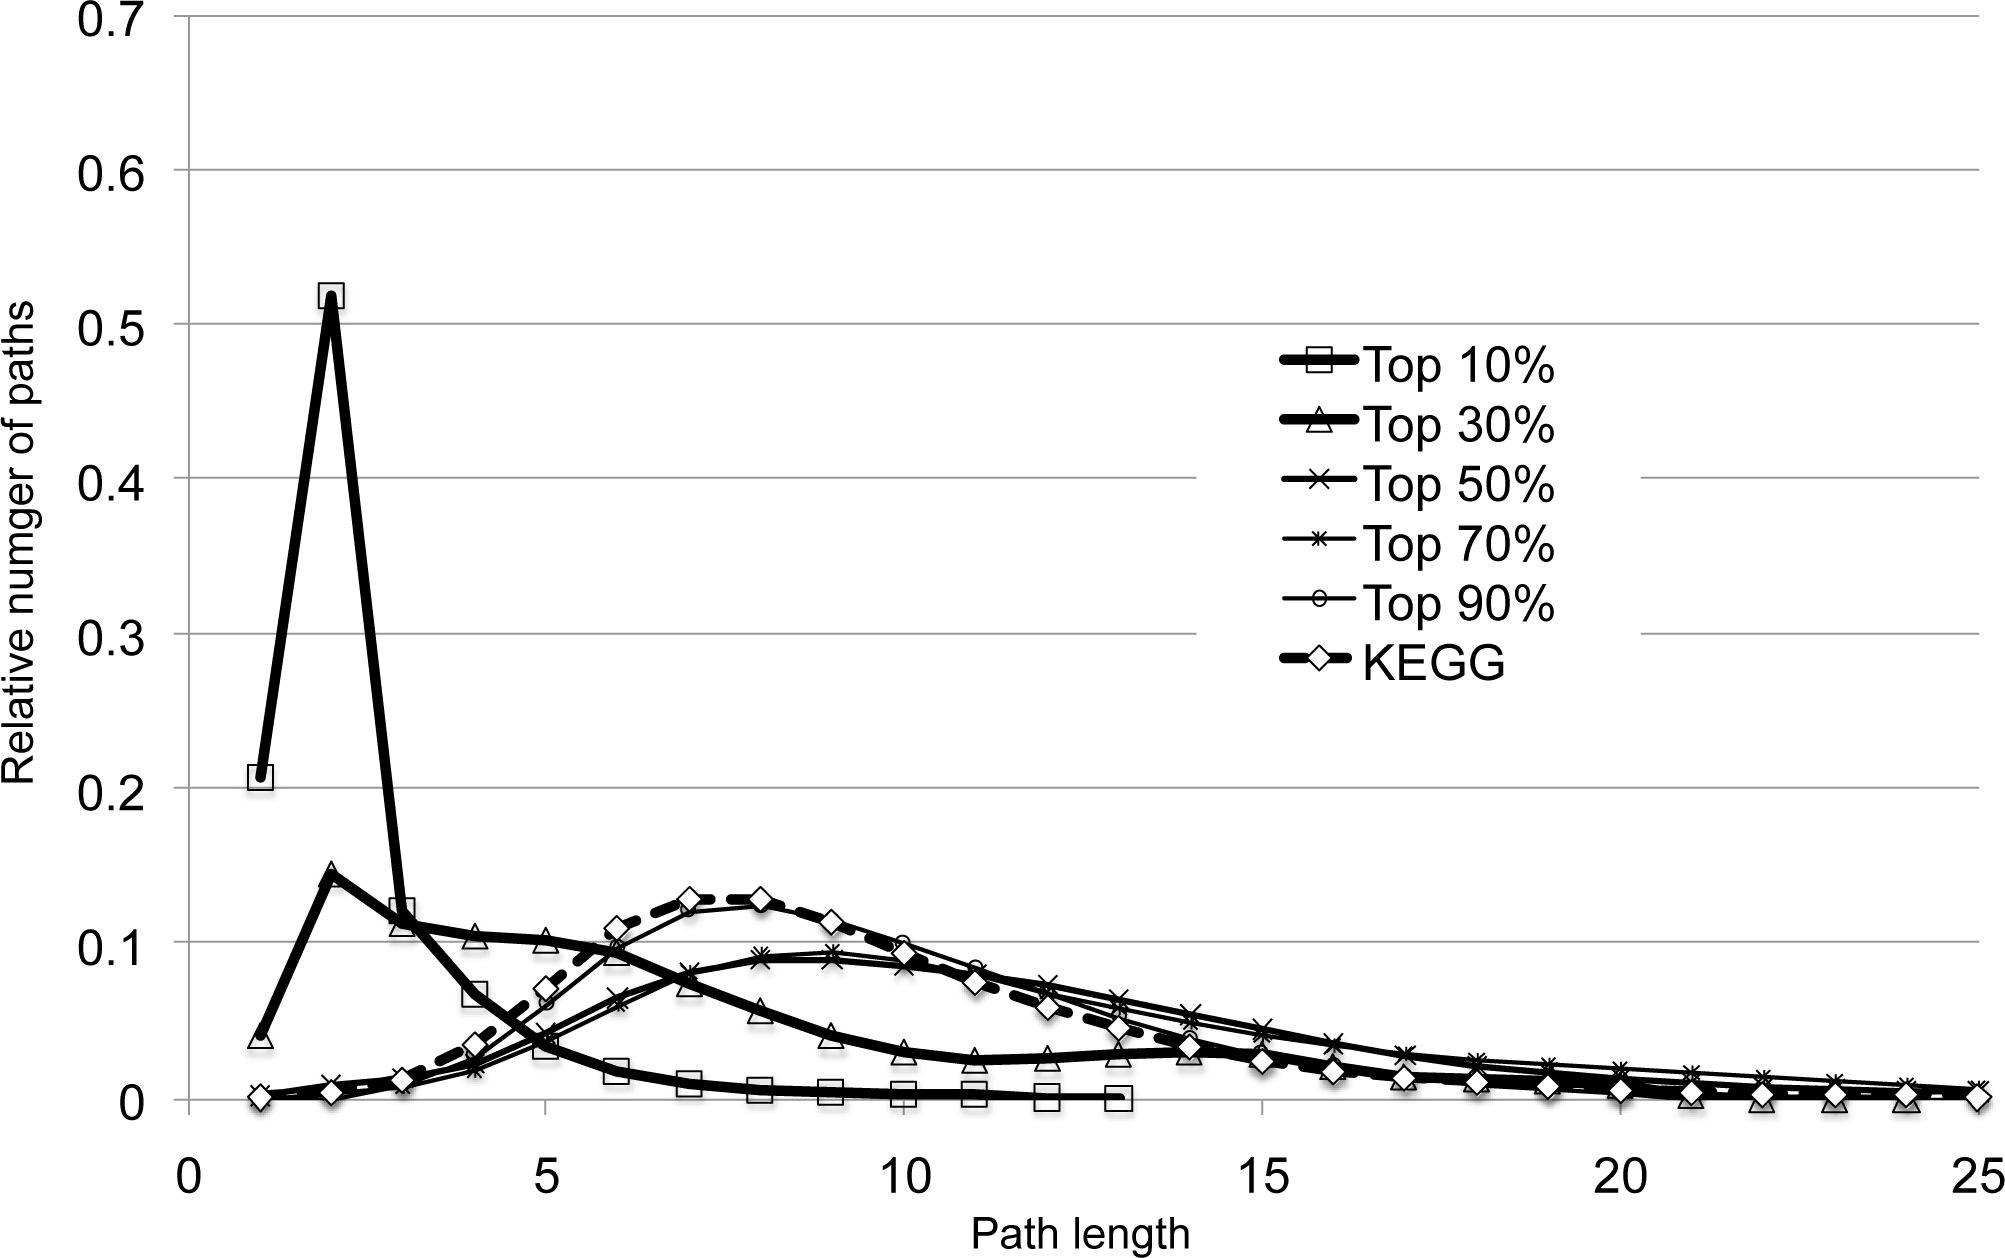
In contrast, it is observed that the path-length distribution of the network generated with the diff-common and diff-only feature vectors are slightly different, especially when considering higher predictive scores (upto 30%), as shown in Figure S2. This observation may imply that diff-common and diff-only feature vectors may have different behaviors in predicting enzyme-reaction likeness. Especially, placing much emphasis on common feature vectors may affect the predictive performance in the circumstances similar to the pathway-based cross-validation shown in section 4.2.

|
|